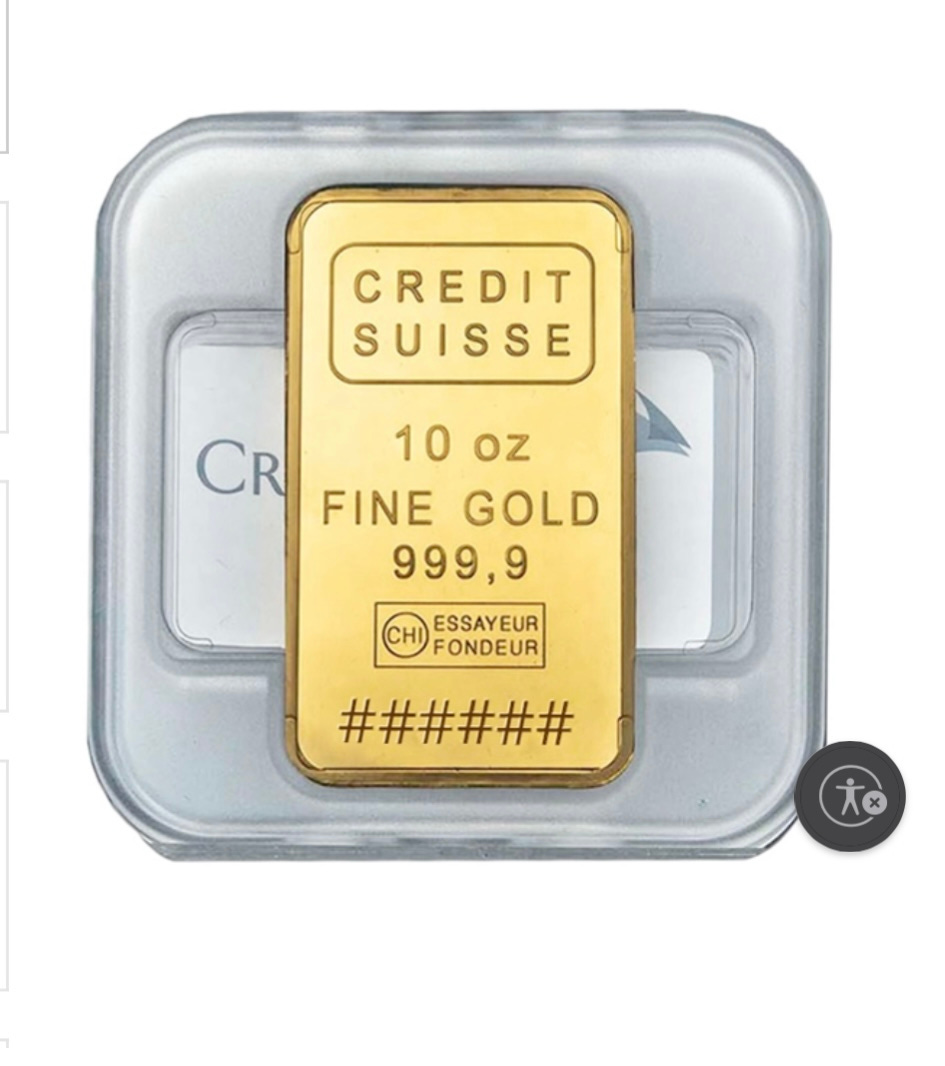
I have to say I love gold. This Credit Suisse 10 oz 24 carat gold bar can be purchased online from Costco for $22,508.80 by e-check or wire transfer
Undeniably beautiful. I can imagine having it on my desk as a paperweight: something to pick up and hold during zoom calls or to promote concentration. Expensive paperweight and it would make me a bit nervous to have it sitting around. I should probably have it custodied by someone whose business that is. I am not sure it would be a good idea for it to be widely known that I had such a thing in my home. I could rest knowing that I would still have it in the event an electromagnetic pulse took down the internet making all the cash and investments I can see online on any device I have. And how would I liquidate it if I need to use gold to purchase goods at Costco, for example, if the internet were to remain down for a few days? Would I shave a little off? What about the wasted dust? I would need to weigh it. Maybe I should buy smaller denomination items. Or maybe I should just buy more units of the GLD ETF and hope the internet stays up...
These are the thoughts I have every time I consider buying physical gold. I know it’s different though because there is no way I could ever shave a little off a certificate of AAPL stock to go buy goods at Costco or Starbucks. It existed before AAPL was born and will probably still exist after AAPL is no more (maybe...). It’s all about price. It doesn’t pay interest. It’s an investment and it’s jewelry; it’s used in iPhones and many other electronic items because it has high conductivity, is easy to work and doesn’t tarnish. It has been intertwined in global economies and geopolitics for centuries and still is. It is much prized in Asia, in India and, right now, in Russia as a currency for undisclosed purchases (think planes flying the stuff around the world).
So, how should we think about it now? What is its role in an investment portfolio and what is moving the price? What will be moving its price in the short, medium and long term?
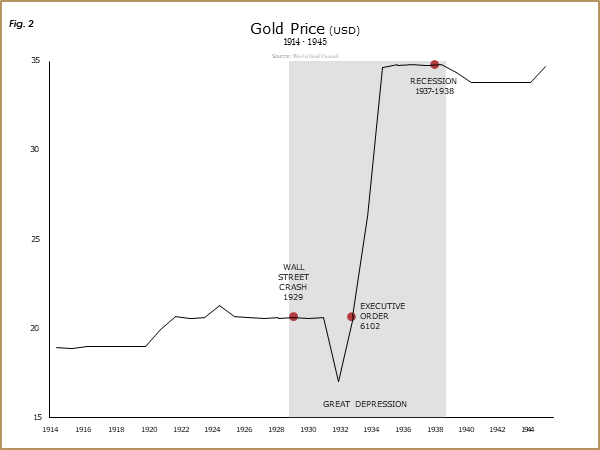
The gold price had been relatively uninteresting until the Wall Street Crash in 1929 (chart courtesy of Grant Williams).
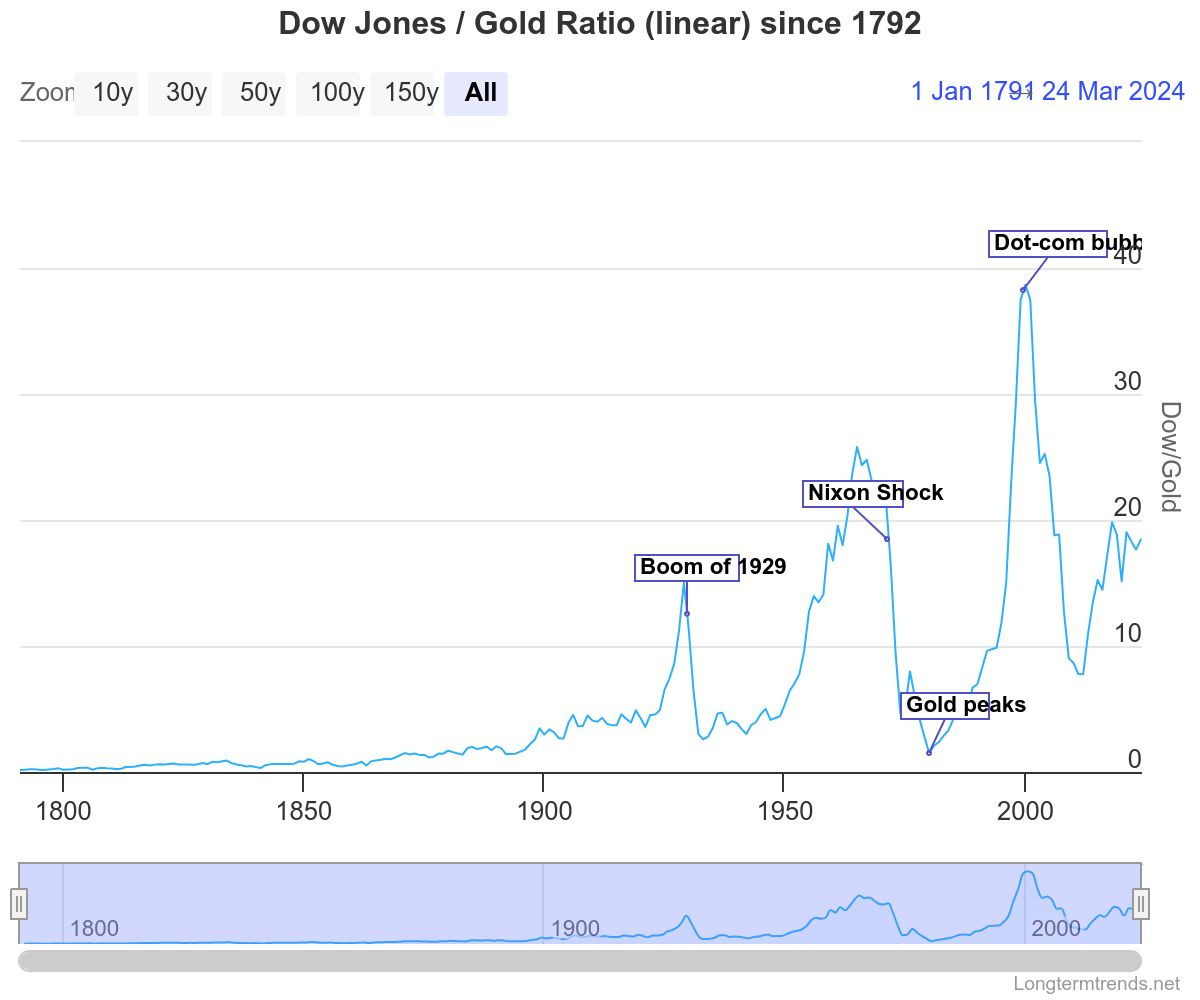
At that point, it got more interesting (thanks to longtermtrends.net for the following charts - a free service and very helpful):
The chart above shows the ounces of gold it takes to buy the shares in the Dow Jones Industrial Average index.
Gold looked solid as a store of value after the market crash in 1929...until FDR passed Executive Order 6102, which essentially required everyone to turn in their gold to the Federal Reserve. People had been hoarding gold and, because 40% of Federal Reserve Notes issued had to be backed by physical gold - a gold standard - the New Dealers were having difficulty expanding credit to bolster/rescue/stimulate the economy.
Once the government had control of the gold reserves, they went to work, revaluing the fixed gold price from $20.67 to $35/oz. The effect was to devalue the currency and allow the Federal Reserve the flexibility to expand credit by issuing more paper money.
WWII saw reserves double to 12,000 tonnes as Allies sent gold to the US in exchange for arms. Post WWII and Bretton Woods, the world started to rebuild and the US was open to buy everyone's exports in exchange for a commitment to support the struggle against the Soviet Union. This, of course, led to the US running trade deficits, financed by USD. The increase in the amount of USD in criculation led to concern that the US would not be able to meet its commitment to the USD/gold exchange rate. In August 1971, under mounting pressure from European currencies and the exit of Switzerland and Germany from the Bretton Woods system, President Nixon suspended the gold standard. Gold took off, from its peg of $35/oz before the suspension of the gold standard to $183/oz in 1974. It continued its rise as inflation took hold, falling only when Volcker put the inflation genie back into the bottle with punishingly high interest rates.
With inflation under control and, post the dissolution of the Soviet Union, a period of relative stability geopolitically saw the gold price fall as Central Banks began to shed their gold holdings.
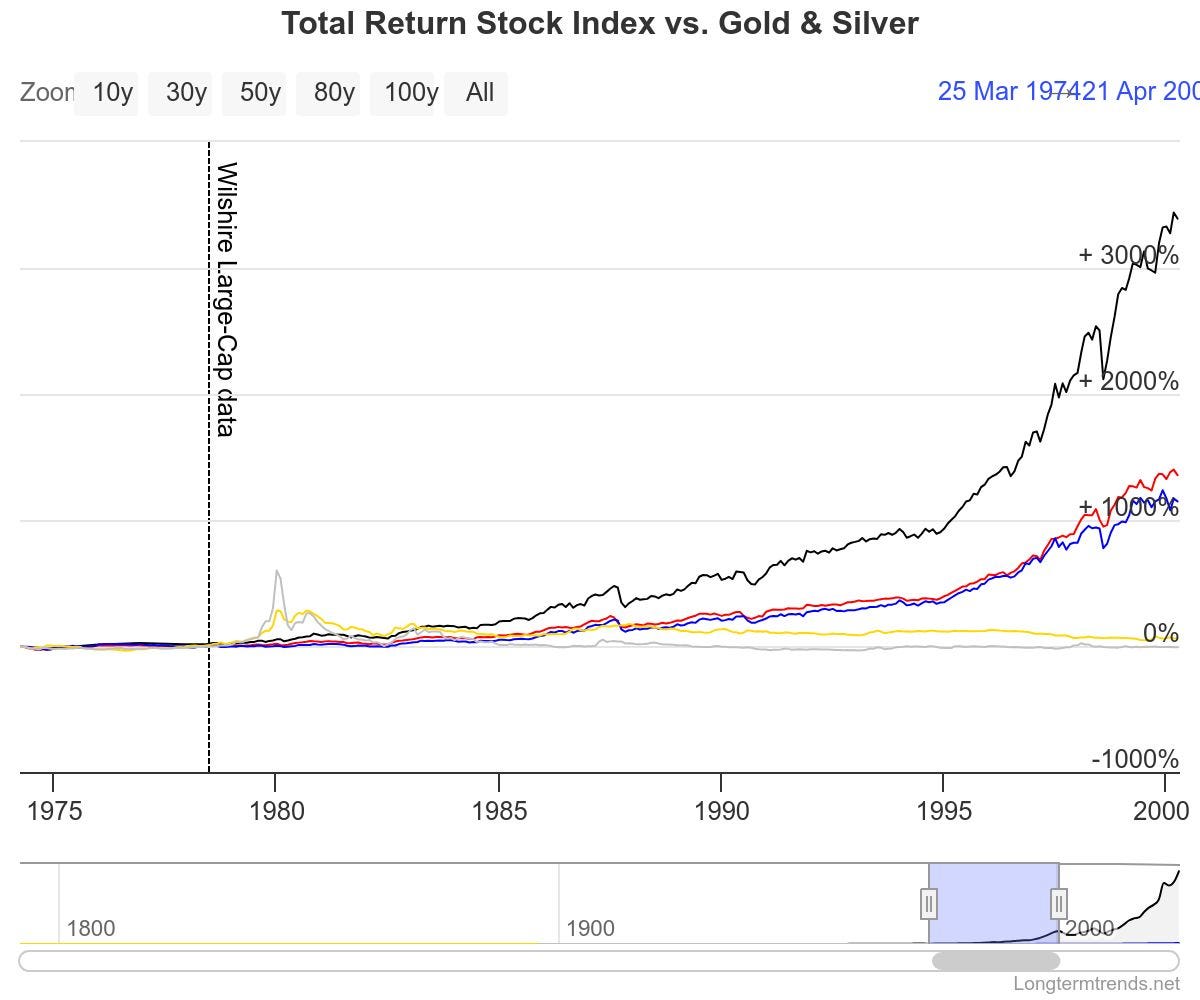
The net effect of all this was that, in the 25 years between 1975 and 2000, the return on gold vs. the other major stock indices was flat: it was an unproductive asset from an investment point of view. Gold hit a low during the dot-com era and, in 1999, signatory Central banks representing around 45% of the global gold reserves signed an agreement capping the amount of gold they would sell over the coming five years at 2,000 tonnes.
This coincided with a period of persistent low interest rates and marked a low point for gold from which it has rallied secularly ever since.
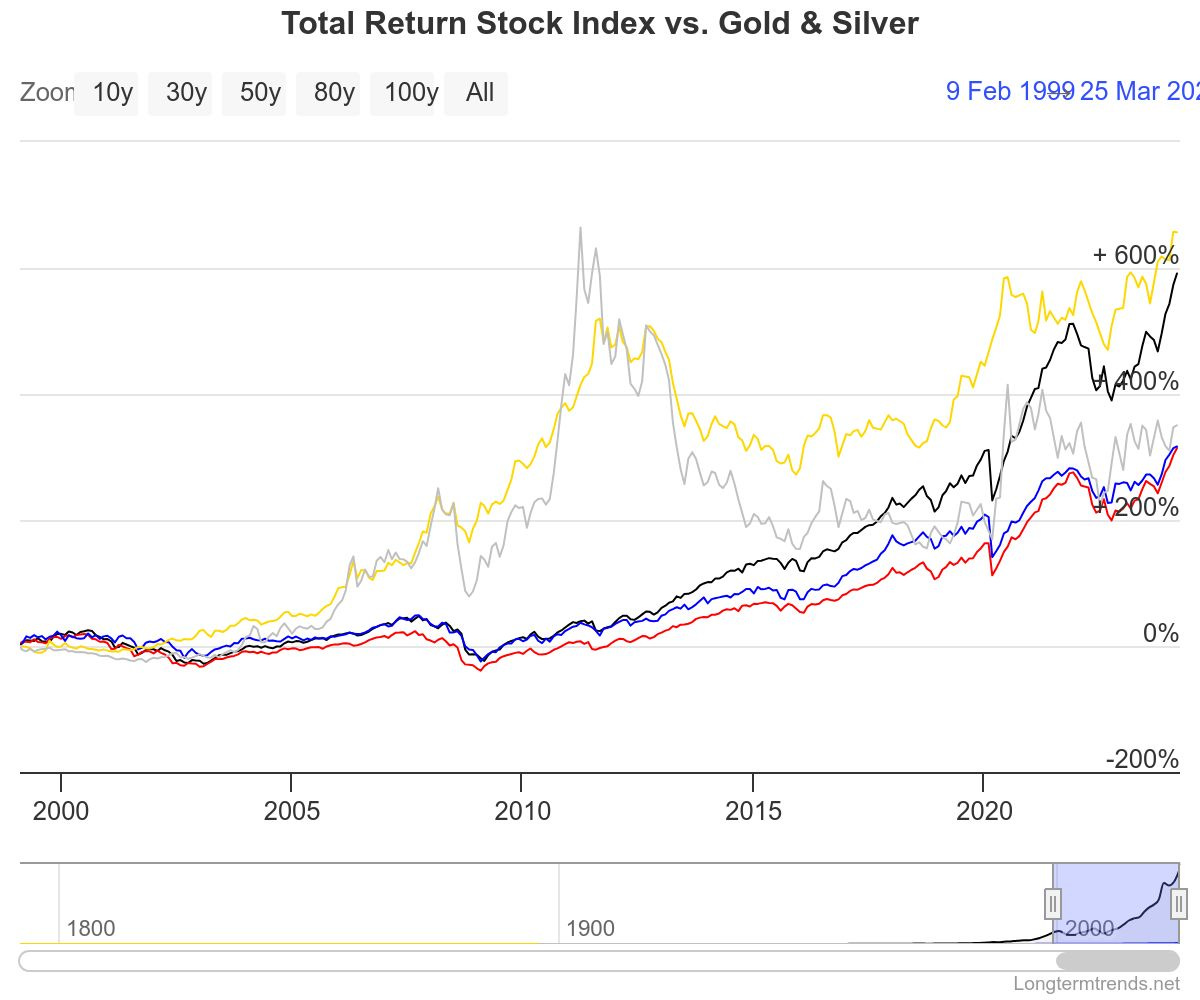
The total return for gold since 2000 has surpassed that of the major stock indices. In USD terms, since 2000, gold has a CAGR of 9.3%.
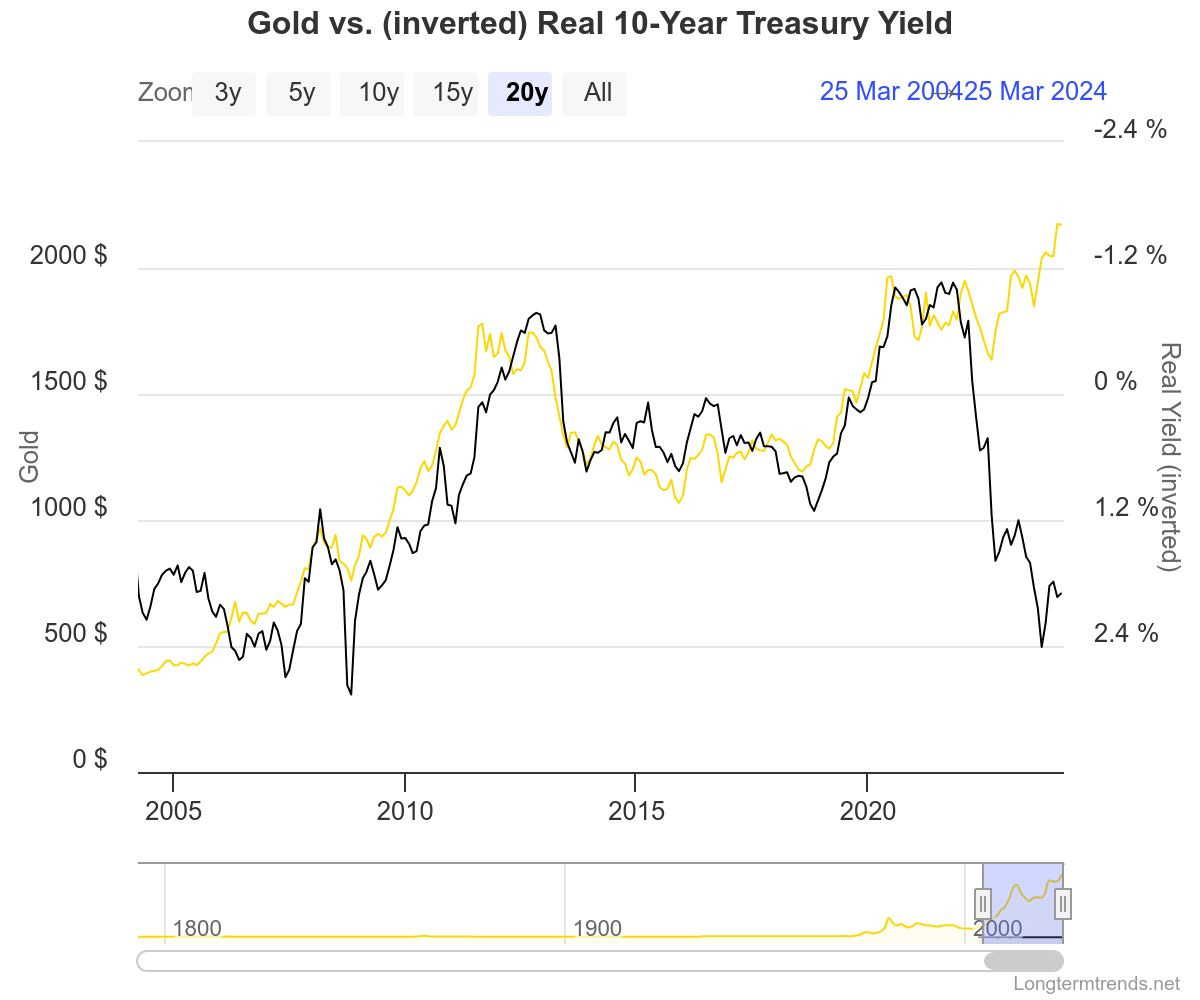
So, having looked at where gold HAS been, it's worth reflecting on where it might be going from here and why. Historically, gold has a negative correlation with real interest rates. The above chart, with gold plotted against the 10-year constant maturity treasury note less inflation, shows a -.82 correlation. Until recently, where the divergence is clear. If the historical relationship is to hold, either real rates need to down, or the gold price needs to come down...unless something has changed. It doesn't appear that nominal rates have a strong downward trajectory, especially with the increase in the deficit and the need to maintain buyer interest. What about the gold price?
G7 Central banks have historically held in aggregate an average of 40% of reserves in gold (48% if Canada, with 0% reserves in gold, is thrown out of the average as the only G7 central bank without gold reserves). Among the BRICS countries, the average is below 20%. BRICS+ countries, are approaching, with over 7,000 tonnes, the total held by the US (over 8,000 tonnes) (China may be underreporting...). The rate at which BRICS+ have been buying, over 400 tonnes per annum, has been accelerating since Russia invaded Ukraine and the US/EU sequestered their USD foreign exchange reserves.
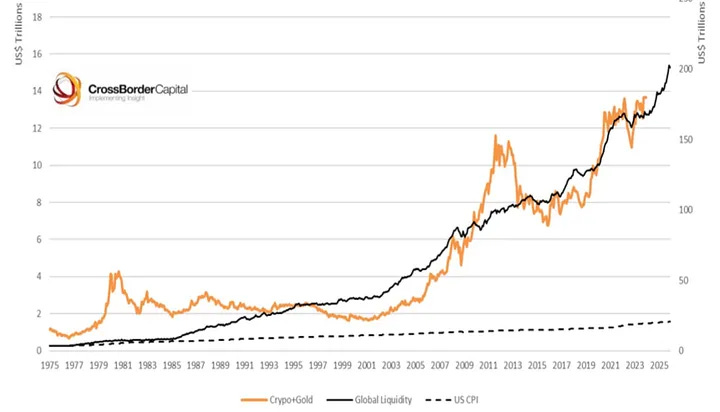
Another key factor in understanding the likely trend in the gold price is global liquidity. Cross Border Capital's Michael Howell follows liquidity closely and, the chart below, plots the correlation between gold, bitcoin and liquidity. It is over 0.8 for all asset prices. Gold has a sensitivity of between 1.5-1.6x (Bitcoin is even higher).
So, if global liquidity rises by 2.25x over the period to 2033, gold could easily rise 3x. If the gold price is showing upward rather than downward pressure, if the correlation between real rates and gold historically is to hold, inflation rising with the increase in global liquidity may be the way to do it: monetary inflation up; nominal rates stay the same; real rates fall, gold price increases...
Costco, in Q3 2023, sold $100MM in one ounce gold bars. Hmmn


