How To Pay Attention and Avoid Confusion in These Crazy Markets
If you're not confused, you're not paying attention
Welcome to Macro Mashup, the weekly newsletter that distills the content from key voices on macroeconomics, geopolitics, and energy in less than 10 minutes. Thank you for subscribing!
Thanks for reading Macro Mashup! Subscribe for free to receive new posts and support my work.
Macro Mashup aims to bring together the greatest minds in Finance and Economics who care deeply about current U.S. and international affairs. We study the latest news and laws that affect our economy, money, and lives, so you don't have to. Tune in to our channels and join our newsletter, podcast, or community to stay informed so you can make smarter decisions to protect your wealth.
The quote is from Tom Peters’ book Thriving on Chaos: Handbook for a Management Revolution. It’s perfect for today’s markets…and the political news cycle.
Volatility - What Is It?
There are indices for equity volatility and bond volatility.
Technically, the Chicago Board of Exchange (CBOE) volatility index, or VIX, is computed using a complex formula that aggregates the weighted prices of multiple S&P 500 put and call options over a wide range of strike prices.
It is widely referred to as the market’s fear gauge.
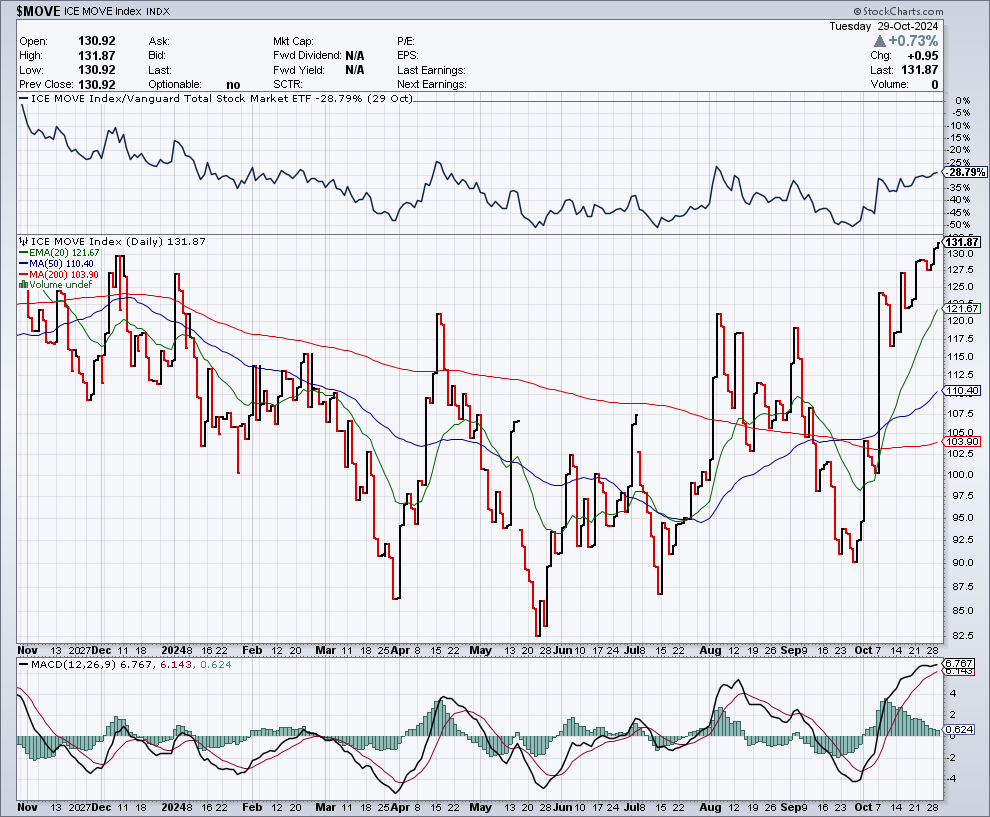
Another key indicator developed by Harvey Bassman while at Merrill Lynch is the Merrill Lynch Option Volatility Estimate (MOVE) index. It measures volatility in the bond market over short and long maturities.
The US Government Bond market is probably the most important financial market in the world. It is the deepest, most liquid, and most referenced market.
It is the benchmark against which most other debt securities are priced (spread over Treasuries) and the highest-quality collateral source for a wide range of transactions.
One of the Federal Reserve's key objectives is ensuring that the bond market functions and is always liquid.
What is Going on at the Moment in These Markets?
The relationship between the stock and bond markets is complex and complicated.
Complicated refers to something difficult to understand but ultimately knowable and predictable. It has many interconnected parts but follows linear, predictable patterns.
Complex refers to something with many interconnected parts that interact unpredictably, making it difficult or impossible to understand or predict fully.
The two markets are very different, and each is complex and complicated.
Stock markets are more complex because they contain enterprise risk—the risk that a company will fail—and entrepreneurial risk—the risk that a company will fail to thrive.
Stocks contain risks, such as how well customers will react to the latest marketing strategy or whether the latest chip will perform to specifications. The latest Spacex rocket may blow up on takeoff.
Bond markets are more complicated: they follow pricing models and have structures that, while difficult to unravel and deterministic, submit to careful analysis.
Interest rate policy and liquidity can be complex, but bond markets are more knowable overall.
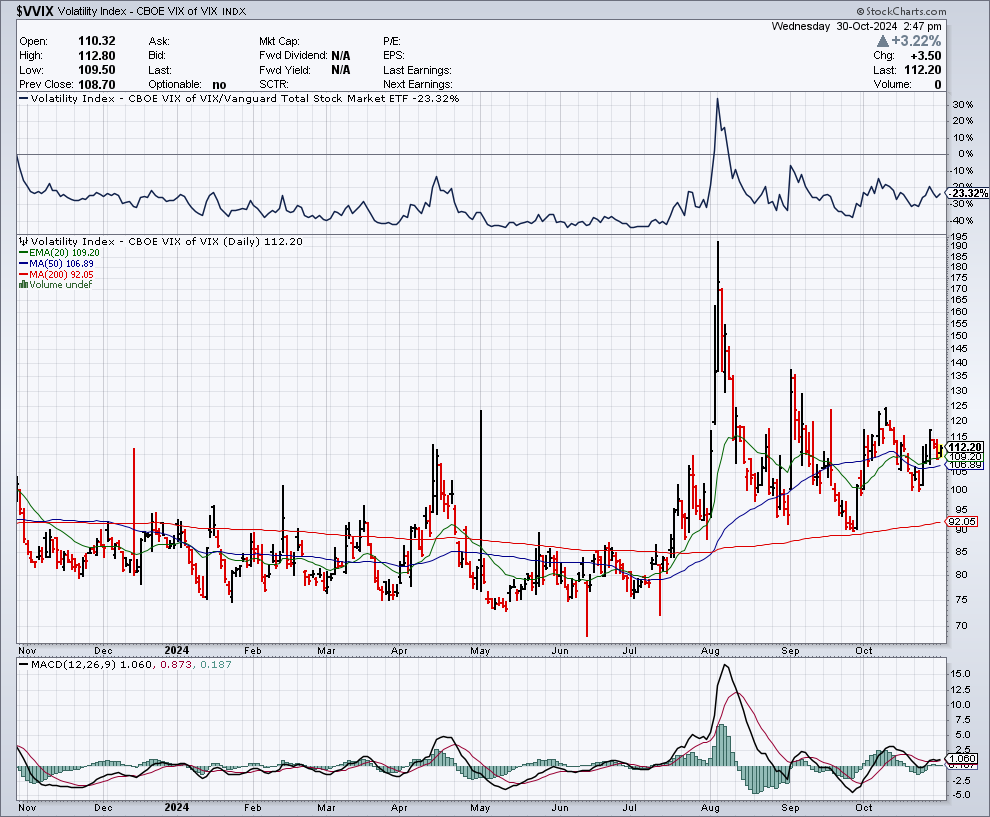
Both VIX and MOVE are elevated at the moment. They are pricing in uncertainty and confusion. People don’t know which position to take.
Look at the MOVE Index. It is at a year high. The VIX peaked in August. So, is the bond market more worried than the stock market?
The Long-Term View
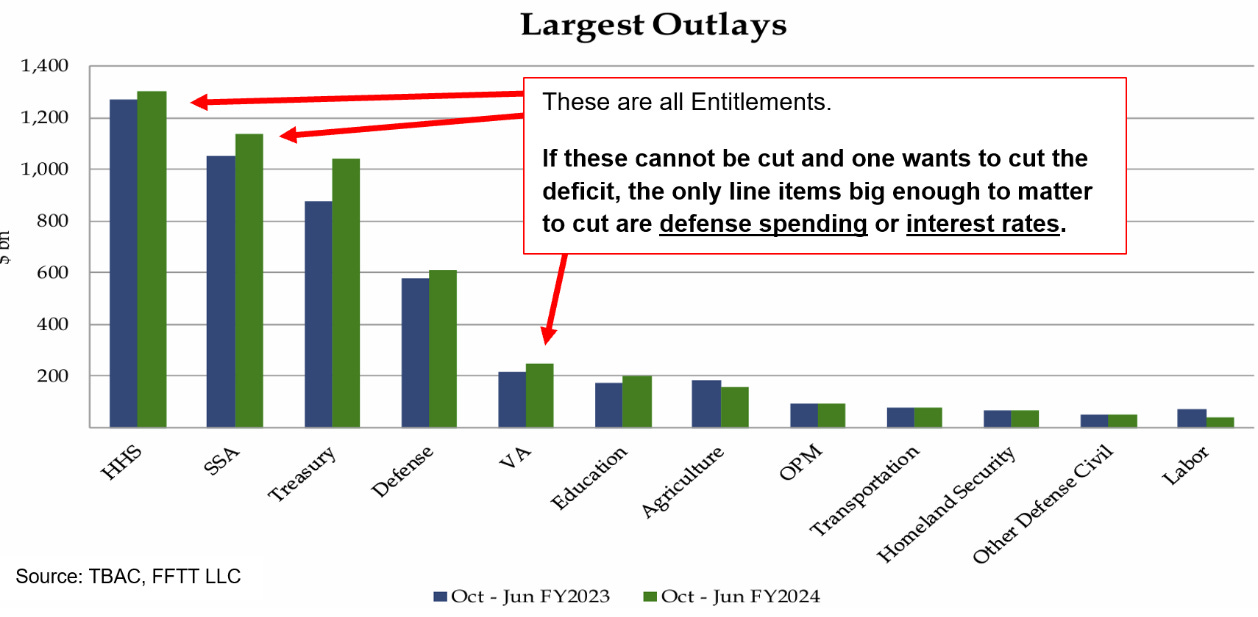
The long-term view is that bond markets are becoming uninvestable. This view focuses heavily on the US budget picture, and it is laid out in Luke Gromen’s Forest for the Trees newsletter.
It focuses on two things that are very different in this economic cycle compared to the post-Bretton Woods world, where the US was in a position of dominance.
Since entering the WTO in 2001, China's rise as a manufacturing powerhouse has caused disinflation in the rest of the world, as it reduced the cost of goods. Because its labor and production costs were lower than anywhere else—certainly than the US—the US effectively hollowed out its manufacturing base and exported it to China.
Post-COVID, and as tensions with China have risen, the US has realized it needs to restore its manufacturing base and have greater control over its supply chains.
Given a higher cost structure—nuclear facilities being a conspicuous but not the only example at 5x the cost of building a traditional plant in China—this trend will be inflationary and require large amounts of capital from the government and the private sector.
Inflation is good for inflating nominal GDP and improving the ratio of government debt to GDP, but it is not good for the value of that debt. Fixed interest rates are less able to compensate holders for the loss of purchasing power caused by inflation.
As purchasers of government debt demand higher interest rates, the government has to find non-economic buyers.
This is what is meant by fiscal dominance. The government will be forced to adopt regulatory measures to find purchasers for its debt. It will compel pension funds and other institutional buyers to hold a certain percentage of their assets in government debt.
It will ease regulatory constraints, making it attractive for banks to buy government debt—I wrote about this here.
It will continue to advertise measures of inflation that exclude certain elements to create the illusion of lower inflation. Retail consumers, however, will continue to feel a disconnect between these measures and their day-to-day purchasing power.
Social unrest is an increasing risk in such an environment.
Holders of financial assets will do fine if they invest wisely.
Onshoring manufacturing is good for manufacturers, especially those supplying the electrical and power grids.
Healthcare will continue to be strong as demand for health services grows with an aging demographic.
The Short- to Medium-Term View
There is another view.
Lance Roberts of Real Investment Advice is the commentator I like most when examining the trading view.
His most recent article is very informative.
In summary, his view is that the evidence does not support the inflation argument I laid out above. At least not to the degree the hype would suggest. Why?
There is no risk of inflation being imported because the vital import markets—China, the UK, and Europe—are not experiencing rising inflation.
The overall tendency of growing government deficits is to slow economic growth rather than promote it.
The projections about fiscal excess tend to extrapolate from COVID-era expenditures and ignore the reversion to pre-COVID trends.
The theory is sound and attractive and offers a convincing narrative, but…reality is not necessarily narrative-conforming.
Roberts notes that:
A common argument from the emerging bond bears is that recent deficits are obscene compared to past ones. Accordingly, bond bears think these increased deficits will be inflationary and require higher yields to satisfy Treasury investors.

While that may be true, the argument lacks context. They fail to mention that the economy has grown significantly over the last few years.

The economy is about $8 trillion, or 33%, larger than it was on the eve of the Pandemic. Therefore, it’s not surprising the amount of debt has grown commensurate with that amount.

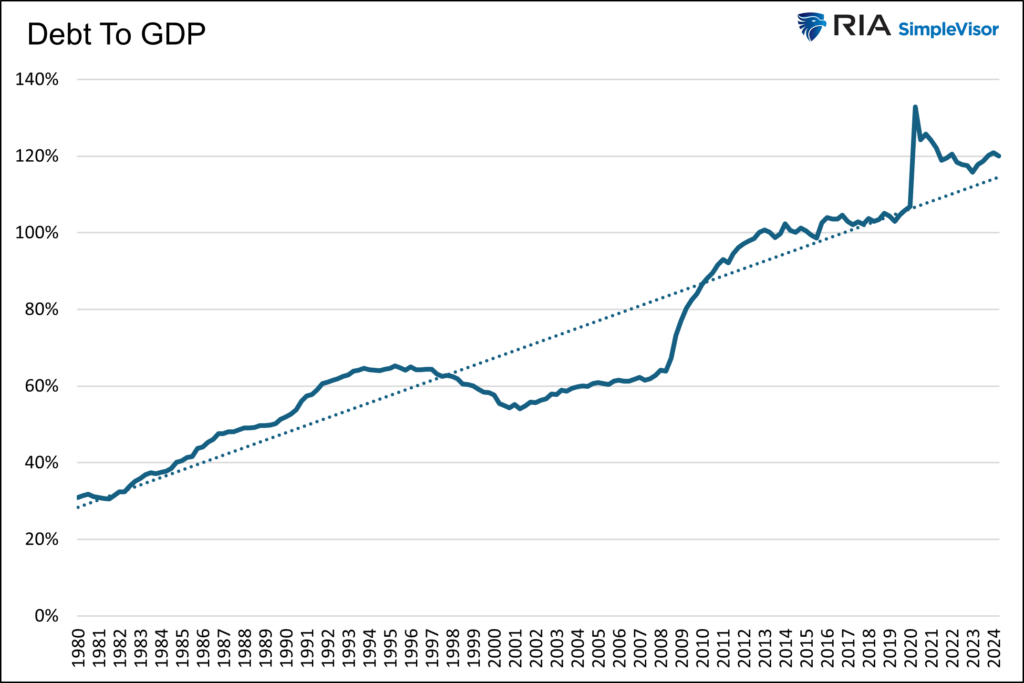
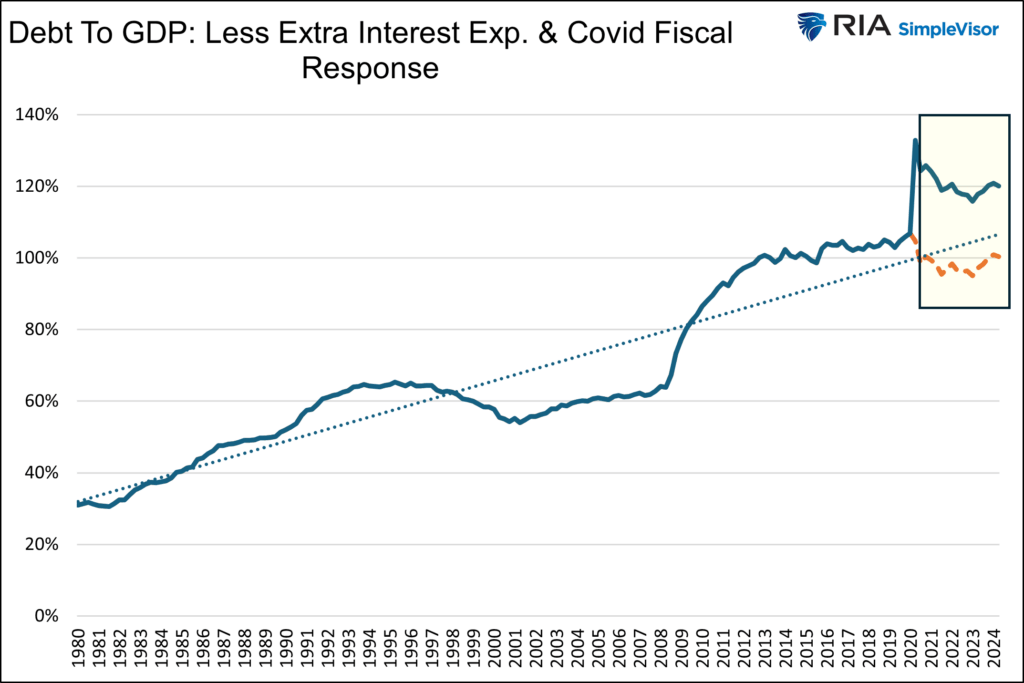
The graph below shows the debt-to-GDP ratio and its trend line since 1980. After the ratio jumped higher on massive COVID-related spending, it settled down slightly above where it was before the Pandemic. Furthermore, it has been flat for the last two years.
He adds a couple of charts to make his point:
The one above illustrates the reversion from a pre-pandemic level of debt to GDP growth.
This one adjusts to illustrate the path we would have been on without the COVID-19 spending.
Now, let’s take the analysis one step further and theoretically calculate what the current debt growth would look like had the Pandemic never occurred. We admit that this is not a traditional way to assess debt, but it does provide unique context on the debt outstanding compared to GDP. To do this, we reduce the debt by the estimated $5.6 trillion spent on COVID relief. Furthermore, we assume the interest expense of the Treasury debt would have stayed on the pre-inflation trend. For perspective, this cuts approximately $500 billion of added interest expense in the past year. The graph below shows the revised debt to GDP in orange. Might it be fair to say that without the Pandemic, current debt issuance would be on par with pre-pandemic debt to GDP levels given the economy’s size? Furthermore, despite the pandemic, spending, debt, and GDP growth have primarily been aligned for the last two years. Roberts concludes that the lower growth and inflation trends asserting themselves before the Pandemic are now beginning to re-assert themselves.
Accordingly, the case laid out by Gromen is a good story but not necessarily predictive or even accurate.
Takeaways
I like both the stories - the Gromen and the Roberts views. They are both quite compelling.
Gromen’s explanation is supported by famed hedge fund managers Paul Tudor Jones and Stanley Druckenmiller, which adds even more credibility.
You cannot read both and not be somewhat confused. I know I am.
You have to take a view. Well, maybe you don’t, but I think it helps keep you sane.
I think, on balance, I prefer Roberts’ explanation for three reasons:
Extrapolating from COVID-19 era seems mistaken
The era of low inflation was also the era of zero interest rates, so I don’t necessarily see the causality.
Japan shows that there is a path to a future of increasing Debt to GDP that does not involve rapidly growing inflation.



I thought this was interesting in light your observations. There is just a lot of uncertainty about what is happening in the bond market. Will bond vigilantes come for America’s next president?
https://www.economist.com/finance-and-economics/2024/10/30/will-bond-vigilantes-come-for-americas-next-president
from The Economist